Currency trading articles
Posted by Paul Sander
Learn to Use Currency Trading Bar Charts
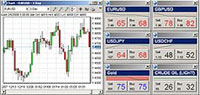
Foreign currency trading bar charts are a type of graphic presentation of the currency price, in which a vertical line is used to connect the highest currency price with the lowest price during a certain timeframe. Currency trading bar charts are also called "OHLC" charts, because they show the currency trading's open, close, high and low prices. Bar charts are used for various reasons, including the placement of currency trading orders
Each Bar displays 5 market data types :
- The high. This is the point at the top of the bar, and represents the highest price the currency reached at the given timeframe.
- The close. The point at the bottom of the bar, and represents the lowest price the currency reached at the given timeframe.
- The Open.This is the small horizontal line that branches to the left of the bar, and represents the currency's opening price.
- The close. The small horizontal line that branches to the right of the bar and represents the currency's closing price.
- The color of the bar. A green currency trading bar chart occurs when the open is lower than the close. A red bar chart occurs when the open is higher than the close.
The most used timeframe for currency trading bar charts are daily charts. Also used are weekly intervals.
The advantage of bar charts is that you get a lot of information condensed in one chart. This is also true for candlestick charts, but many traders prefer bar charts because these charts can be displayed when the bars are seen as connected. Each new bar starts with the open price, which follows the previous close price on the same position.
Learning about bar charts is only the Foreign Currency Trading Fundamentals, and much more is needed to be learned, about Techinical analysis for instance, in order to trade correctly.
Posted by Paul Sander