
Currency trading articles
Posted by Richard Hollar
Learn to Use Currency Trading Line Charts
A currency trading line chart is used for technical analysis, and consists of a single line connecting all the closing prices. These connected prices show the general price movement of a certain foreign currency over a chosen time frame. Line charting is not only used for Currency Day Trading, and is a known investment chart type.
Foreign currency trading line charts are usually used to see the general direction of the currency. Unlike bar charts or candlestick charts, you are not able to see open, close, high or low statistics using currency trading line charts. These charts are graphically simple and easy to use, and are especially beneficial when you are viewing multiple currency trading charts at once.
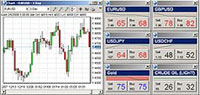
Here is an example of a typical currency trading line chart:
Some foreign currency trading investors regard closing prices as the most important figure to take notice of, and this is why line charts are so popular today, and are one of the most used foreign currency trading charts.
Posted by Richard Hollar