Forex On Demand

Foreign Currency Trading

Professional Currency Trading Accounts
  • Home
  • Currency Trading
  • ForexTerminology
  • Market Order Types
  • Technical Analysis
  • Reading Charts
  • Fundamental Analysis
The forex market Why currency trading Opening an Account Calculating Profit & Loss Currency trading articles Selecting Broker
Pips and Ticks Currency Trading Quotes Leveraged trading and margin
Placing Orders Market Orders Limit Orders Stop loss orders Take profit orders Trailing stop orders Entry Orders
Technical Analysis Understanding charts Line charts Bar charts Candlestick charts Point & Figure Charts Long & short positions
Trend types Uptrends Downtrends Sideways Support resistance Triangles Head shoulders Tops bottoms Flags pennants rectangles
Fundamental Analysis Major Indicators
Trader Application
The leading independent currency trading platform.
Get it now for free


Goverment Policies

  • Fiscal policies
  • Monetary policies
  • Reserve requirements
  • Discount rates
  • Open market operations
  • Exchange rates
  • Intervention
Currency trading articles

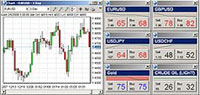
Learn to Use Currency Trading Candlestick Charts

Candlestick charts are a very commonly used type of currency trading charts. A candlestick chart displays the OHLC, meaning the open, high, low and close prices for the given time interval. This is similar to what a bar chart displays.

The advantage of candlestick charts is that they are perhaps the most easily read currency trading charts in the market.

Candlestick charts weren’t initially used for the currency trading market. They were used by Japanese merchants since the 18th century. Because of their effectiveness they have survived to enter modern currency trading. Today candlestick charts are mainly used for currency exchange trading from across the globe, and is considered highly beneficial by professional as well as amateur foreign currency trading investors.

Candlestick chart structure

A currency trading candlestick charts is built from two parts - the real body and shadows.

The real body is the thick part of the candlestick chart that displays the open and close price.

  • A red real body happens when the currency's close is lower than the open. In that case the top point of the real body is the open and the bottom point is the close.
  • A green real body happens when the currency's close is higher than the open. In that case the top point of the real body is the close and the bottom point is the open.
An example of a currency trading candlestick chart

Shadows are the upper and lower lines that stem from the real body. The upper shadow's peak is the currency highest price for that time period. the lower shadow's low point represents the currency's lowest price for that time period.

Doji is a candlestick chart concept you should know about. A doji is a candlestick that has no real body. This occurs when the open and close prices are the same. A doji usually signifies that the powers of supply and demand are at an equilibrium.

Apart from currency trading candlestick charts, you should also get to know other charting tools, such as line charts. This will give you a better choice when handling online trading of currencies.


Posted by Paul Sander

News

20/07/11
State Street Cuts 850 Jobs After Earnings Miss Estimates
http://www.businessweek.com/
20/07/11
Caixin Online: South China Sea energy riches beckon
http://www.marketwatch.com/
20/07/11
Earnings Preview: Philip Morris Int'l
http://news.yahoo.com/
20/07/11
Coca-Cola’s Results Are Lifted by Overseas Business
http://www.nytimes.com/
Getting Started?

Getting Started?


Download our forex trading software - Receive a FREE Demo account by Easy-Forex.com
Apply Now
Forex Pro Account

Forex Pro Account


Get your pro account with exclusive benefits such as instant deposits, fixed spreads, continuous quoting and more!
Apply Now

Free Tools

Forex Currency Converter Forex Currency Converter
Forex Pivot Point Calculator Forex Pivot Point Calculator
Forex Margin Calculator Forex Margin
Calculator

ICTS Currency Trading Presentation


Forex Video Presentation

Watch our step by step video presentation. An introduction to the ICTS foreign currency trading platform.

Watch Presentation

Home  |   Contact   |  Catalogue   |  Content Finder
Privacy declaration  |   Copyright information  |   Disclaimer  |   Terms of use
Copyright © 2014 ForexOnDemand.com. Foreign Currency Trading. All rights reserved.